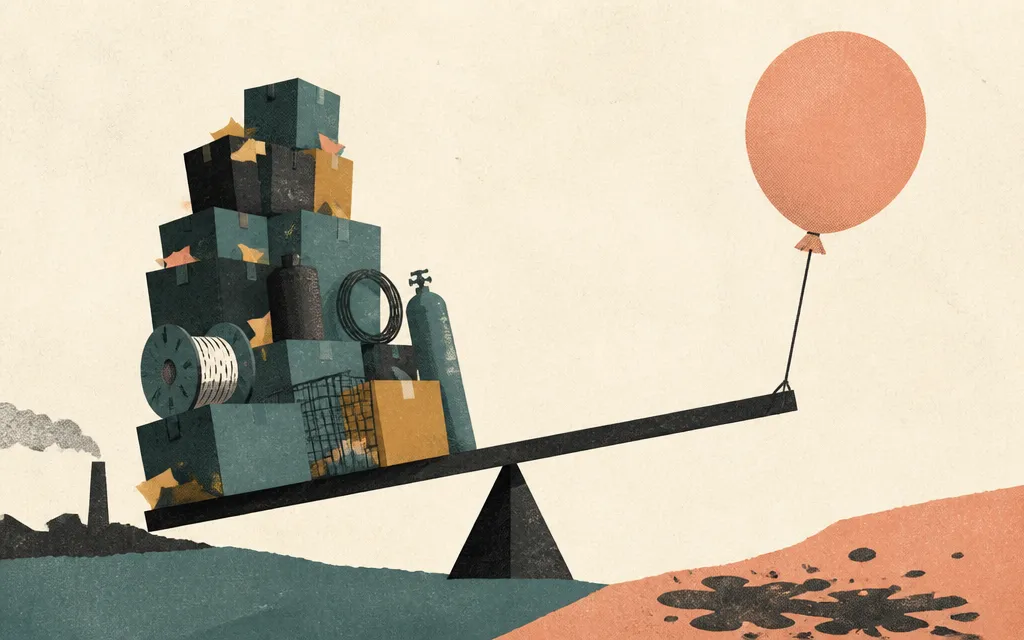
ESAB sold a lot more and earned far less.
Revenue rose 12.9% to $807.6 million in the three months ended July 3, 2026, compared with the same period a year earlier. Gross profit grew even faster, but operating income fell 27.8% and net income dropped 51.6%. At the latest close, ESAB shares were down 2.5% at $92.41.
The first read is a bigger business with a smaller operating engine. Gross margin actually improved to 38.0% from 37.2%, which makes the decline below that line more important: operating margin fell to 9.7% from 15.2%.
Management attributes the pressure to the acquisition of EWM, plus freight and material costs tied to higher oil prices. The company put it this way:
"The decline of adjusted EBITDA margin and Core adjusted EBITDA margin was primarily due to dilution from the EWM acquisition as well as higher freight and material costs due to oil price increases related to the war in Iran."
ESAB, Form 10-Q, Aug. 6, 2026
In plain English, the filing says the acquisition diluted adjusted EBITDA margin while freight and material costs rose. The filing does not quantify how much of the quarter’s operating-income decline came from EWM versus those costs, but the margin split shows where the pressure landed.
The bottom line also carried a financing charge. For the six months ended July 3, interest expense and other, net increased by $18.4 million, including $4.8 million of fees tied to a bridge loan for the acquisition and a higher average debt balance.
"Interest expense and other, net increased by $18.4 million in the six months ended July 3, 2026 compared to the prior year period due to $4.8 million of fees associated with the Bridge Loan commitment that the Company entered into to fund the Acquisition as well as a higher average outstanding debt balance."
ESAB, Form 10-Q, Aug. 6, 2026
That disclosure connects the acquisition to more than operating dilution. It also adds financing costs, a factor relevant to the decline in net income, though the disclosure is for six months rather than this three-month comparison.
Cash generation offers another complication. Cash fell 15.8% to $217.5 million, while inventory increased 22.7% and receivables also grew faster than sales. Capital spending consumed a larger share of revenue, and free-cash-flow margin declined by 1.6 percentage points. The company does not disclose a single cause for the inventory and receivables changes.
ESAB’s annual record gives the current margin a useful reference point. Revenue was $2.8 billion in 2025, up 3.7%, while operating margin was 14.5% and net margin was 8.0%. The latest three-month figures sit below both annual levels, with the acquisition and cost pressures appearing in a period that otherwise delivered strong sales growth.
The balance sheet now includes $1.0 billion of net debt, and the latest report shows why the acquisition question is broader than whether EWM adds sales. ESAB’s next quarterly report should provide the next comparable read on operating margin, cash, and inventory after another reporting period with the acquisition in the numbers.
Sales are growing, but the acquisition, financing, and operating costs are taking a larger share of each dollar.
Source: ESAB Form 10-Q filed Aug. 6, 2026.